|
|
|
In order to assess the environmental health of Merrymeeting Bay, sediment samples were taken from 14 sites on the Androscoggin River, the Bay, and the Kennebec River and analyzed for grain size, TOC, metals, poly-aromatic hydrocarbons (PAHs), pesticides, and sediment congeners. Contaminant concentration values were compared with available E.P.A standards. Principal components analysis and analysis of covariance were used to determine differences in pollutant levels between the Androscoggin, Kennebec, and Bay. Grain Size and TOC were corrected for in these analyses. It was found that the Androscoggin had higher levels of mercury and most PAHs, while the Kennebec had higher levels of Cr. As, and Se. The Bay showed intermediate levels of these pollutants.
Merrymeeting Bay is located in Southeast Maine between the towns of Brunswick and Richmond. Its orientation is Northeast to Southwest with Richmond to the North and Brunswick to the south. Merrymeeting Bay is about 5 miles long and 2 miles across at its widest part. There are two major rivers that feed into Merrymeeting Bay: the Kennebec and the Androscoggin. A location map of the Bay can be found in Figure 1.
The Androscoggin enters Merrymeeting Bay from the southwest curving past Lewiston and then by Brunswick before entering the Bay. The Kennebec flows down from the northeast through Augusta and Richmond before entering the Bay. The Kennebec also serves as the Bay's outlet to the Atlantic Ocean. The Kennebec enters the Bay from the north and then reemerges in the eastern part of the Bay before flowing by Bath and out into the Atlantic. Merrymeeting Bay is primarily freshwater. Only late in the fall, after hot dry summers, is hightide saltwater able to enter the Bay.
Although many other Bays in the area had been studied for pollution, no studies had recently been performed on Merrymeeting Bay. For this reason, the State of Maine joined with Bowdoin College to perform a study of the major contaminants found in the Bay. Pollution levels were analyzed from sediment samples taken from Merrymeeting Bay, the Androscoggin, and the Kennebec. The State of Maine Department of Environmental Protection was responsible for measuring the levels of an array of metals, pesticides, polyaromatic hydrocarbons (PAH), and sediment congeners. The authors of this report determined the grain size of the sediments and the total organic carbon (TOC) found in the sediment.
Grain size and total organic carbon measurements were made because the size of the sediment particles and the amount of organic material present affects the amounts of metals, pesticides, PAHs, and congeners that will be present in the sediment. Scientists have found that metals bind preferentially to smaller sediment sizes (i.e. silt and clay) as well as organic carbon particles. Together, these mineral and organic particles act as a reservoir for many contaminants, especially metals. A higher concentration of contaminants will be found in sediment with finer mineral particles and more organic carbon (Krumgalz 1989).
Once all of the data was collected, it was brought together and analyzed. The metals, pesticides, and PAH data were compared with environmental standards to determine if the levels of the pollutants exceeded government standards. In addition, multiple statistical analyses were performed on the data to determine if there was a significantly larger amount of pollution entering the Bay from either the Kennebec or the Androscoggin. Some of the statistical analyses used grain size and TOC data as covariates to adjust for the fact that metals bind differently to sediments of different sizes and to sediments with different levels of TOC.
Fourteen sampling sites were chosen between Brunswick and Richmond: 3 on the Androscoggin, 5 in Merrymeeting Bay, and 6 on the Kennebec. These sites were initially chosen using a chart of the Bay and rivers to locate calm areas such as coves and eddies where contaminant-rich fine sediments would accumulate. On October 14, 1994, the sampling was performed. A boat was launched in Brunswick, and samples were taken first in the Androscoggin, then across the Bay, and finally up the Kennebec. Figures 2a through 2d show the locations of the sampling sites. Figure 1 can be referred to for the location of these sectional maps within the Bay.
Each site was sampled in the following fashion. After locating the general area of the site from a chart of the Bay, a specific location was chosen, avoiding areas of excessive vegetation while trying to chose an area with the finest sediment possible. The boat was anchored and the latitude, longitude, and height above sea level were recorded using a Magellan Trail Blazer (Global Positioning System device so that the sites could be located again for further work. An Eckman Grab sampling device was lowered to the bottom and sediment was brought to the surface. The sediment was homogenized in the grab and then divided into separate sterile containers for the different tests. Samples for the total organic carbon analysis and grain size analysis were taken back to Bowdoin College and placed in a freezer. A scientist from the Maine D.E.P. took the samples for the other tests back to Maine D.E.P. headquarters to be sent off to a lab for testing.
All techniques for pre-treatment of samples were taken from Lewis (1984). The sediment from each site was thawed and rehomogenized. Approximately 100 grams of wet sediment was sieved with a 850 micron sieve in order to remove any macro-organic material. Any course grains and organics caught in the sieve were dried and saved. The wet fraction that passed through the 850 micron sieve and any extra distilled water were placed in a beaker. Approximately 50 milliliters of 30% H202 was added to the beaker to remove any micro-organic matter, which tends to aggregate the clay particles. Each sample was left to stand in the peroxide for approximately 4 days, or until foaming had ceased. The sediment was then heated in the beaker to 60 degrees Celsius in order to react any remaining peroxide. After cooling, each sample underwent ultrasonic treatment in order to further disaggregate the particles.
All techniques for grain size analysis were taken from Lewis (1984). The sediment from each site was emptied from the beaker and washed through a 4Ø (63 micron) sieve in order to separate the mud fraction from the rest of the sample. Copious amounts of distilled water were used to wash the mud fraction. Washing continued until the water passing through the sieve was perfectly clear, indicating that all mud particles had been extracted. The coarse fraction caught in the 4Ø (63 micron) sieve was placed in a crucible, along with any particles caught in the 850 micron sieve, dried in a drying oven, and saved for later analysis.
The mud fraction was then placed in a 1 liter graduated cylinder along with 20 milliliters of 50 g/L Na4P207, used as a deflocculating agent. The column was filled to the 1 liter mark with distilled water, mixed with a plunger, and allowed to stand for 24 hours to allow deflocculation to occur. After this time, a pipette analysis was performed on the mud fraction for each site. The column was mixed with a plunger, after which 20 milliliter samples were taken with an automatic pipette at specific time intervals and specific depths, as outlined in Table (?). Each 20 milliliter sample was dried in a drying oven and weighed.
Grain size analysis was then performed on the combined coarse fraction from above by dry-sieving the fraction with sieves at 1/2Ø-size intervals from 0.5Ø to 4.5Ø. The fraction caught in each sieve, including the pan, was weighed. The data for each site was entered on a spreadsheet and calculations were made for the proportion of total sample weight that was represented by each grain size. More general calculations were also made for percent sand, silt, and clay. Calculations were also made for the arcsin of the square root of the mud proportion values (arcsin (square root (mud proportion))) for each site, to be used in later statistical analyses. These will be referred to as "adjusted mud values."
Any sediment not used to determine grain size was used in TOC analysis. Approximately 40-50 grams of dried sediment was placed in a pre-weighed crucible and the organic carbon allowed to fully combust (32 to 48 hours) in a muffle furnace heated to 400 degrees Celsius. The crucible was then weighed. This was repeated for all fourteen sites in triplicate. Calculations were made as to the percent of mass lost. The TOC value for each site was determined as the average percent mass lost for the triplicate runs.
After the data was received from the state of Maine, the first analysis was simply to compare the metals, PAH, pesticides, and congener data with E.P.A. standards to see if there were any violations (Senten and Charlier 1991). Some of the sites contained nondetect readings (ND). For the metals and PAHs, all ND's were changed to values equal to one half of the detection limit for the particular pollutant. The next step was to use a variety of statistical analyses to determine if there were any statistically significant differences in pollution levels between sites in the Androscoggin, the Kennebec, and the Bay. There were three main statistical programs used for our analysis: Data Desk®, Systat®, and SuperAnova®. Data was compiled on Microsoft Excel® before it was transferred to the statistical programs.
Principal components analysis was performed on Systat® for all 14 sites using the 8 metals as variables. Using the metal concentrations, Eigenvectors were calculated for 3 axes (x,y,z). From these Eigenvectors, three sets of scores (one for each axis) were calculated for each of the 14 sites. These scores were imported into Data Desk® and rotational x,y,z plots were created. The plot was rotated on the computer in order to determine if there was any clear separation of sites. Eigenvector values were compared with the rotational plots to determine which metal variables were most important in separating the sites on each axis. Similarly, Eigenvectors, scores, and a rotational plot were created for the 14 sites using the 24 PAHs as variables.
A variety of significance testing was the next step. Data for grain size distributions, TOC levels, and contaminant (metals, PAHs, etc.) levels were imported into SuperAnova® and an analysis of covariance was performed for the 14 sites using the contaminants as the dependent variables. At this point, the 14 sites were classified as Kennebec, Androscoggin, or Bay in order to make comparisons easier. Sites 1 through 3 are the Androscoggin, sites 4 through 7B are the Bay, and sites 8 through 12 are the Kennebec. In the first analysis of covariance test, TOC and adjusted mud values were used as covariates in order to adjust the contaminant levels for the effects of grain size and TOC. As mentioned before, contaminants such as metals are found more often in finer grained, higher TOC sediment; by adjusting for the various grain size distributions and TOC levels found at each site, the sites in the Androscoggin, Kennebec, and Bay could be compared on equal ground. Three additional analysis of covariance tests were performed: with mud as the covariate, with TOC as the covariate, and with no covariates.
A Sheffe's S significance test was used to determine if the contaminant levels differed between sites in the Androscoggin, Kennebec, or Bay. When covariates are used, the Sheffe's S test compares arithmetic means values with adjusted variance to calculate critical differences (p-values). Adjusted variance is calculated by taking into account the covariates. Sheffe's S tests were used in all four of our analysis of covariance tests. The sites in the Androscoggin and Kennebec were compared to each other, as well as to the Bay. A significant difference was declared if p-values were less than 0.05. An arithmetic means Table was created on SuperAnova® for those contaminants that differed significantly between sites, according to Sheffe's S tests. Arithmetic means values were compared to the results of each of the four Sheffe's S tests in order to determine if higher levels occurred in the Androscoggin, Kennebec, or Bay.
In addition to the Sheffe's S test, a t-test of differences between adjusted means was performed for each of the three covariate combinations: mud/TOC, mud only, and TOC only. This significance test compared least squares means values with adjusted variance to calculate critical differences. A significant difference was declared if p-values were less than 0.05. Least squares means calculations adjust contaminant concentration data for differences in grain size and TOC. Least squares means tables were created for the significant pollutants in each of the t-tests of differences between adjusted means. These were examined after a significant difference was found for a particular pollutant in order to determine if higher levels occurred in the Androscoggin, Kennebec, or Bay.
In order to determine if the 8 metals were truly correlated with smaller grain sizes in our samples, Pearson Product-Moment correlations were calculated with Data Desk® for the original metal concentration data for each site with the grain size data for each site. Graphs were created on Excel® for correlation values versus grain size.
The sediment data for metals (from the Maine D.E.P.) is listed in Table 1. The environmental standards for the metals are also listed in Table 1. For each metal, there are two standards listed, ER-L and ER-M. No E.P.A. standards were available for selenium. Most of the metals do not appear to be found at hazardous levels in the sediment. The only metal that has a concentration near the level deemed by the E.P.A. as highly polluted is arsenic. An arsenic level of at least 8 mg/kg is considered "highly polluted sediment". Sites 10 and 11 in the Kennebec showed arsenic levels of 6 mg/kg.
The data for the 28 PAHs measured by the Maine D.E.P. can be found in Table 2, along with environmental standards. The site with the highest levels of PAHs is site 2 found in the Androscoggin. Site 2 contains the highest PAH level for every PAH tested except acenaphthene and phenanthrene. The levels of acenaphthene and phenanthrene were highest at site 1. The ER-L standards were violated at site 2 for Benzo(a)Anthracene, Benzo(a)Pyrene, and Bibenz(a,h)Anthracene. The Maine D.E.P. also collected data for pesticides and soil congeners. Tables 3 and 4 list the data for pesticides and congeners. As indicated by Tables 3 and 4, no congeners or pesticides were detected at any of the sites. For this reason, no statistical analyses were performed on either the pesticide or congener data.
The results from the grain size analysis appear in Figure 3. Sand can be defined as sediment greater than 4Ø, mud is sediment between 4Ø and 9Ø, while clay is sediment finer than 9Ø. Site 7A had the most sand and site 6 had the most mud. Appendix 1 has the raw grain size data for all sites.
Percent lost can be defined as the amount of sediment lost during the sieving process. As previously stated, the mud and sand fraction for each sample were separated by washing the sample through a 4Ø wet sieve. During the dry sieving process for some of the sites, however, a significant amount of particles finer than the smallest sieve (4.5Ø) accumulated in the pan. Since the phi size of the sediment contained in the pan was unknown, it was deemed "percent lost."
There are two main reasons why the sediment may have been "lost". First, all of the mud may not have been separated from the sand when the sample was washed through the 4Ø sieve. If all of the mud was not separated, it would appear in the pan during dry sieving. The second reason is that some of the mud may have adhered to larger grain sizes. When the sand fraction was put through the shaker during dry-sieving, any adhered mud was dislodged from the coarse particles and accumulated in the pan. Site 7B and sites 9B through 12 had percent lost values that were quite large, in some cases greater than the value for percent clay. The sediment that was "lost" must be finer than 4Ø, so it can be considered mud. Therefore, the "lost" fraction can be combined with the silt and clay fractions to determine the percent of mud (Appendix 2).
The data for TOC is summarized in Figure 4. Sites 6, 10, and 11 have the largest amount of organic material. Site 7A has the smallest amount of organic material. The raw TOC data is summarized in Appendix 3.
Figure 5 gives the Eigenvectors generated from the principal components analysis for metals, as well as a rotational plot of the scores generated for each site. Approximately 73 percent of the variability was seen on the X axis. On this axis, Copper had the largest positive value and mercury had the smallest positive value. Thus, these metals were most responsible for separating the data.
Figure 6 gives the Eigenvectors generated from the principal components analysis for PAHs, in addition to a rotational plot of the scores for each site. About 80 percent of the variability is in axis X. Dimethylnaphthalene and acenaphthylene had the most positive values and biphenyl had the least positive Eigenvector value on this axis. Thus, these PAHs were most responsible for separating the data.
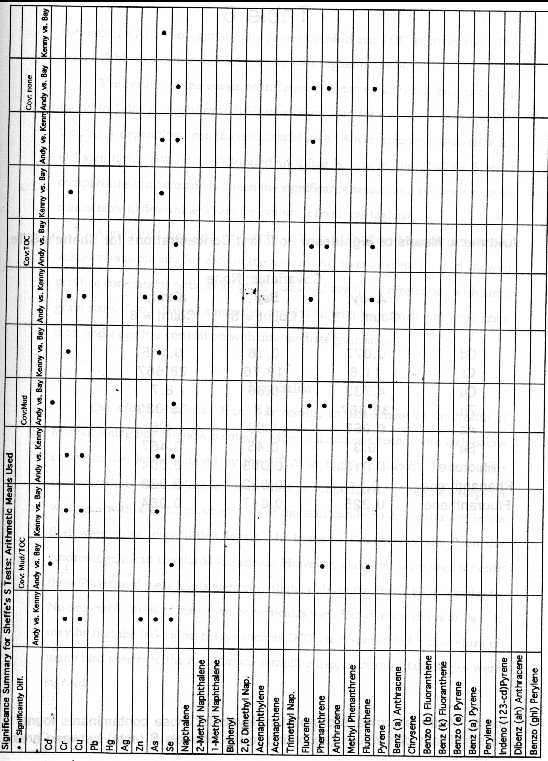
The results of the Sheffe's S significance tests can be seen in Table 5. The presence of a dot indicates that a significant difference occurred (according to Sheffe's S criteria) for a particular pollutant. Significant differences were seen for 6 of the metals and 3 of the PAHs, depending upon the covariate(s) used. An arithmetic means Table for the significant pollutants can be found in Table 6. Cadmium can be used as an example linking the means table and the results of the significance tests. Significant differences were seen in cadmium levels between the Androscoggin and the Bay using Mud and TOC as covariates. The means Table shows that cadmium levels were higher in the Bay.
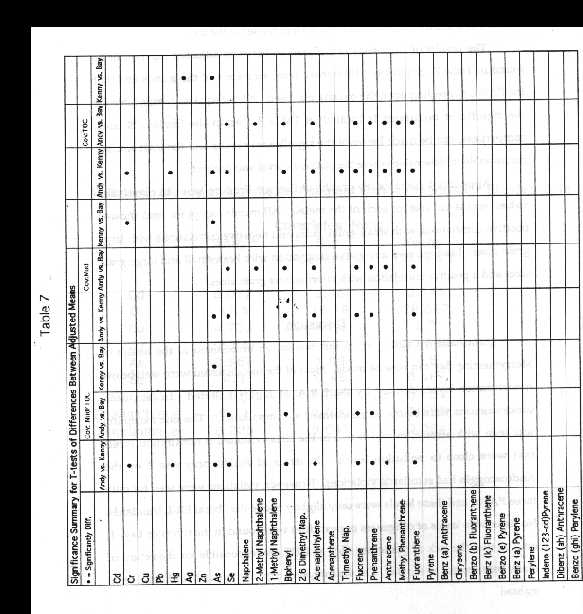
The results of the t-tests of differences between adjusted means can be found in Table 7. Significant differences were seen for 4 of the metals and 9 of the PAHs, depending upon the covariate(s) used. A least squares means table for the significant pollutants is located in Table 8. As in the Sheffe's S tests, comparisons can be made between the significance results and the least squares means table to determine where the pollutant level was highest.
Appendix 1 contains the graphs of Pearson Product-Moment correlation values versus phi size for each of the metals ( Cadmium, Copper, Lead). All metals except for lead showed positive correlations with small grain sizes and negative correlations with large grain sizes. Lead showed a negative correlation with both small and large grain sizes and a positive correlation with intermediate grain sizes.
From our results, an assessment of the health of Merrymeeting Bay can now be made. Most of the metals tested were well below concentration levels defined by the E.P.A. as highly polluted. In fact, their concentrations were below levels defined as "unpolluted." The one exception was seen with arsenic, in which two of the sites exhibited concentration levels that were close to pollution levels. In terms of PAHs, only site 2 on the Androscoggin had standards violations. However, violations were seen for only three PAHs, and these levels were only slightly above the liberal ER-L standards. No detectable levels of congeners or pesticides were found in the rivers or Bay. It may be that the lack of pesticides such as DDT are responsible for the return of many bird species to the Bay. On the sampling trip, numerous Bald Eagles were sighted.
TOC levels in the Bay and rivers were well below levels that normally cause eutrophication. Values of organic material ranging from 0.3 percent to 3.8 percent were found. TOC values were seen as high as 16 percent prior to the eutrophication event that occurred in Maquoit Bay in 1989 (E.S.G. pers. comm.). Merrymeeting Bay does not seem to be in any danger of eutrophication.
The correlation plots in Appendix 1 prove the affinity of metals for mud particles. In almost every metal analyzed, a positive correlation was found for particles finer than 4Ø, while a negative correlation was found for coarser particles. These plots further prove the need for the grain size adjustment used in the upcoming metals analyses. The one exception was seen with lead. This metal seemed to be mostly correlated with particles in the 4Ø-6Ø range. One explanation offered is that Merrymeeting Bay is a prime duck hunting area, and that lead was used in the ammunition until about 1985. Ducks tend to feed in grassy areas which are usually characterized by silty sediment. This extra source of lead in the silty sediment may have skewed the correlation curve (E.S.G. pers. comm.).
The rotational plot of metals scores shows good a separation of sites. The sites in the Androscoggin are grouped together, the sites in the Kennebec are grouped together, and the sites in the Bay are grouped together. The X axis is most responsible for separating the sites, with 73 percent of the variance. The Y axis is less important in separating the data, accounting for only 12 percent of the variance. According to the Eigenvectors for the X and Y axes, the sites in the Androscoggin occur in the lower right quadrant of the rotational plot, which represents high levels of mercury, and low levels of copper, chromium, cadmium, zinc, lead, arsenic, and selenium.
The sites of the Kennebec occur mostly in the upper left quadrant of the rotational plot. This quadrant represents high levels of copper, chromium, cadmium, zinc, lead, arsenic and selenium along with low levels of mercury. Interestingly, the grouping of sites in the Bay occur in between the two river groupings. Sites 4, 5, and 6 are more similar to sites in the Androscoggin, with high levels of mercury and low levels of the other metals. Sites 7A and 7B are more similar to the Kennebec with high levels copper, chromium, cadmium, zinc, lead, arsenic, and selenium. Not surprisingly, sites 4, 5 and 6 were geographically closer to the Androscoggin and sites 7A and 7B were geographically closer to the Kennebec.
The interpretation of the metals rotational plot may be misleading because the effects of grain-size and TOC were not taken into account. It may be that the reason why sites in the Kennebec have higher levels of most metals than sites in the Androscoggin is that sites in the Kennebec have on average more mud and TOC. Figure 3 shows that all sites found in the Kennebec, except site 9A, appear to have much higher mud proportions than the Androscoggin sites. Higher TOC levels for the Kennebec are indicated in Figure 4. In addition, the arithmetic means for each river seems to indicate a large difference in mud levels.
A Sheffe's S test was performed to see if there are significant differences in mud levels between these two rivers. No significant differences were found by the Sheffe's S test, which may be due to the wide variability of mud levels seen between site. It may be that the separation of sites on the rotational plot is solely due to the differences in grain size found, rather than actual differences in the amount of metals present. The metals rotational plot would have clearer meaning if grain size distributions were similar in the Androscoggin and the Kennebec, or if concentration values were first adjusted for grain size and then plotted.
The Sheffe's S test using mud and TOC as covariates attempts to mathematically correct for the differences in grain size and TOC levels.
Therefore, variability in contaminant levels owing to grain size and TOC can be controlled for, allowing the true differences in contaminant levels to be expressed. The results of this test indicate that there were significant differences in 6 metals: Cd, Cr, Cu, Zn, As, and Se. The following conclusions can be made using the Sheffe's S test:
�Cadmium levels differ between the Androscoggin and the Bay. From the arithmetic means Table, it can be concluded that cadmium levels are highest in the Bay. Higher levels are seen in the Kennebec over the Androscoggin.
�Chromium, copper, and arsenic levels differ between the Kennebec and the Androscoggin, and between the Kennebec and the Bay. The means Table indicates higher concentrations of Cr, Cu, and As occur in the Kennebec.
�Zinc levels differ between the Androscoggin and the Kennebec. Means tables indicate more Zn in Kennebec.
�Selenium levels differ between the Androscoggin and the Kennebec, and between the Androscoggin and the Bay. Means tables indicate more Se in both the Bay and the Kennebec.
Inherent problems lie in the Sheffe's S analysis, however. This test compares arithmetic means (no covariates used) to adjusted variances (covariates used) in deciding where significant differences occur. Since grain size and TOC levels play such a large role in dictating metals concentrations, least squares means of the metals concentration data, instead of the arithmetic means, should be compared to adjusted variances. The results of the Sheffe's S analysis seem to indicate that higher metal concentrations are found in the Kennebec. This may be misleading because the arithmetic means are not adjusted for grain size and TOC. The conclusions that higher levels of metals are found in the Kennebec may be based solely on the fact that the Kennebec is muddier and contains more TOC than the Androscoggin. Therefore, the above conclusions may be invalid.
What the Sheffe's S test fails to do, the t-tests of differences between adjusted means is able to accomplish. This significance test provides a way of comparing least squares means of concentration data (adjusted for grain size and TOC) with adjusted variance in deciding where significant differences occur. The results of the test indicate significant differences occur for the following metals: Cr, Hg, As, and Se. The following conclusions can be made:
�Chromium and mercury levels differ between the Androscoggin and the Kennebec. Means tables indicate more Cr in Kennebec, but more Hg in the Androscoggin.
�Arsenic levels differ between the Kennebec and the Androscoggin, and between the Kennebec and the Bay. The means Table indicates that higher concentrations of As occur in the Kennebec.
�Selenium level differ between the Androscoggin and the Kennebec, and between the Androscoggin and the Bay. Means tables indicate more Se in both the Bay and the Kennebec.
Now that grain size and TOC have been correctly adjusted for, the above conclusions appear to be valid. Interestingly, fewer significant differences are found. The only problem with the t-test of differences between adjusted means is that it tends to be very liberal in assigning significant differences. This will become more apparent when PAHs are discussed.
The rotational plot using PAHs as variables shows good separation of Androscoggin sites from the Bay and Kennebec sites (Figure 4). Site 1 exists at the far negative end of the Y axis. On this axis, Eigenvector data tells us that acenapthene and fluorine are the most important PAHs in separating this site. Site 2 exists at the far positive end of the X axis. Eigenvector data tells us that 2-methylnapthalene, acenaphthylene, and methyl phenanthrene are most important in separating the data. Since 80 percent of the variability is seen in the X axis, site 2 is more separated from the Bay and Kennebec than the other two Androscoggin sites. Site 3 exists at the far positive end of the Z axis. Biphenyl appears to be the most important PAH separating this site from the rest. It can be concluded that sites 1, 2, and 3 have high levels of these contaminants. Sites on the Kennebec and Bay exist near the origin. Therefore, the rotational plot tells us that these sites have intermediate levels of the PAHs mentioned above.
As with metals, high levels of PAHs should be found in sites with more mud and TOC. Our data contradicts this fact since higher levels of PAHs were found in the sandier Androscoggin sites. Of course, it may be that there is no source of PAHs in the Kennebec or Bay.
Even though mud and TOC do not appear to be as strong factors in dictating PAH levels, the results of the Sheffe's S tests and the t-tests of differences between adjusted means are still interesting. The Sheffe's S tests indicated significant differences in 2 PAHs, using mud and TOC as covariates (Table 5). The following conclusion can be made:
�Phenanthrene and Fluoranthene levels differ between the Androscoggin and the Bay. Arithmetic means tables indicate higher levels of both pollutants in the Androscoggin.
The Sheffe's S test has the same problems here as it does in the metals analysis in that arithmetic means of PAH concentrations are compared to adjusted variance. The fact that so few significant differences were found could be the result of a lack of grain size/TOC adjustment. Since the Kennebec contains a lot of mud its sites should contain more PAHs than the Androscoggin. The data has indicated, however, that the significant pollutants are higher in the Androscoggin even though the Androscoggin contains more sand. For this reason, it appears that the Androscoggin actually contains more PAHs than the Kennebec. The problem is that even if the source of PAHs in the Androscoggin was much higher, the PAH values would not appear significantly larger than the Kennebec because the Kennebec contains more mud/TOC. Therefore, grain size/TOC needs to be adjusted for. After grain size adjustment, there should be a larger number of significant differences between the Androscoggin and Kennebec because the levels of PAHs will be artificially raised in the Androscoggin and lowered in the Kennebec. Before grain size and TOC adjustment, there was not a large enough difference in PAH levels in the Androscoggin and Kennebec to cause a large number of significant differences.
The t-tests of differences between adjusted means take grain size into account by comparing the least squared means and the adjusted variance. As expected, there were a larger number of significant differences in PAHs when grain size was adjusted. In Scheffe's S there were only significant differences in 2 PAHs while with the t-tests of differences between adjusted means there were significant differences in 6 PAHs. The results of the t-tests of differences between adjusted means indicate:
�Biphenyl, fluorine, phenanthrene, and fluoranthene levels differ between the Androscoggin and the Kennebec, and between the Androscoggin and the Bay. Least squares means tables indicate more biphenyl, fluorine, phenanthrene, and fluoranthene in the Androscoggin than in the Bay or Kennebec.
�Acenaphthylene and anthracene levels differ between the Androscoggin and the Kennebec. Least squares means tables indicate more acenaphthylene and anthracene in the Androscoggin.
As expected, there were a larger number of PAHs that significantly differed between sites when a t-test of differences between adjusted means is used. For the PAHs in which significant differences were found the Androscoggin always had higher levels then the Kennebec or Bay. One possible reason that the Androscoggin may have had larger numbers of PAHs is that it is right next to Route 1. The automobiles could have contributed PAHs to the Androscoggin in the form of combustion products and gasoline/oil runoff. Two known combustion products, Fluorine and anthracene, were found in higher levels in the Androscoggin. Another explanation for higher PAH levels in the Androscoggin, is that effluent from the Brunswick sewage treatment plant enters the river near Site 2. The sewage treatment plant does not remove any PAH contamination (E.S.G. pers. comm.).
The problem with the t-test of differences between adjusted means is that it tends to be very liberal, assigning significant differences where there may be none. Therefore, there may not actually be 6 PAHs that are significantly different between sites. The t-test of differences between adjusted means appeared much more liberal when dealing with PAHs than with metals.
Merrymeeting Bay appears to be in good health. Most of the metals are found in concentrations well below environmental standards. Only arsenic is even close to any level deemed by the E.P.A. as polluted. PAH levels for Benzo(a)Anthracene, Benzo(a)Pyrene, and Dibenz(a,h)Anthracene exceeded ERL standards at site 2. No pesticides or sediment congeners were found in Merrymeeting Bay.
Although most of the government standards have not been exceeded, there is still a particular pollutant signature associated with the Androscoggin, Kennebec, and Bay. The t-test of differences between adjusted means was used to determine these signatures because it corrects for grain size and TOC. The only problem with this test is that it tends to be very liberal.
The Androscoggin appears to have the highest levels of PAHs and mercury. The Kennebec seems to have the highest levels of most metals: Cr, As, and Se. As expected the Bay acts as a mixing area for the Androscoggin and Kennebec with pollutants levels between the two rivers.
Although some basic conclusions have been made about contaminant levels in the Bay, this is only a preliminary study. A more accurate study would include more sites, more accurate grain size analysis, and larger study area that encompassed more of the Androscoggin and Kennebec. Another improvement of the present study would be to sample sites that have approximately the same grain size and TOC level. Having sites of the same grain size and TOC level would avoid the statistical analysis problems that occurred in the study. After an accurate assessment of the pollution levels around the Bay is made, the next step would be to sample behind the dams that are further up the Kennebec and Androscoggin. Clay tends to accumulate behind dams, and thus acts as a reservoir for pollutants. Although the Bay appears healthy, it may be that the pollutants are leaking out from the dams very slowly and that these areas contain dangerously high levels of contaminants.
Now that some of the major pollutants of the Bay have been identified, it is important to investigate historical and current sources of these contaminates. For example, mercury is known to be used in the paper industry for bleaching. Since more mercury was found in the Androscoggin, it may be that the Androscoggin has more paper mills. Arsenic is used in embalming fluids in cemeteries. It may be that the Kennebec watershed has more cemeteries than the Androscoggin. Another area where arsenic is used is as an insecticide on blueberry fields. Other contaminants such copper, zinc, lead, cadmium, and chromium are used in metalworking and machining processes. In order to accurately determine the sources of pollutants for Merrymeeting Bay, a comprehensive study of all industries along Kennebec and Androscoggin would have to be performed (Hawes 1993).
We would like to thank Ed Gilfillan, Ed Laine, Peter Lea, and Nicole Maher of Bowdoin College. In addition, we would also like to thank John Sowles and the Maine Department of Environmental Protection.
Gilfillan, E.S. (l995) Personal Communication. Bowdoin College. Brunswick, Maine.
Hawes, Edward L. Historic Sources of Pollution in Portland Harbor.
Casco Bay Estuary Project.
1993.
Krumgalz, Boris S. (1989). "Unusual Grain Size Effect on Trace
Metals and Organic Matter in
Contaminated Sediments." In Marine Pollution Bulletin: 20 (12), 608 -
611.
Lewis, D. W. Practical Sedimentolog!~. Hutchinson Ross Publishing
Company: Stroudsburg,
Pennsylvania, 1984, pp.227.
Long, E.R. and L.G. Morgan. (1990). "The potential for biological
effects of sediment-sorbed
contaminants tested in the National Status and Trends Program." NOAA
Technical Memorandum
NOS OMA 52. Rockville, MD: US Department of Commerce, National
Oceanic and
Atmospheric Administration, National Ocean Services.
Senten, J.R. and Charlier, R.H. (1991). "Heavy Metals Sediments
Pollution in Estuarine and Coastal Waters: Corrective Measures for
Existing Problems." In International Journal of Environmental
Studies: 37, 79 - 96.